“Diversity is being invited to the party. Inclusion is being asked to dance.” – Verna Myers ®
Digital technology is transforming how companies can use data and analytics to optimize environmental factors such as light and temperature levels, traffic flow, and floorplans. Similar technologies can help them optimize another critical resource: the people who work there―both how they feel and perform. Combining traditional HR data and performance metrics with these newer data sources reveals workplace dynamics that were invisible to them even just a few years ago.
One of the most promising applications is in measuring inclusion and tracking its progress over time. But before companies can leverage these capabilities, they must first define what inclusion means.
Diversity ≠ Inclusion
Diversity and inclusion are often treated as synonyms or strung together like a hyphenated last name. In fact, they are quite different. Diversity is about numerical representation―the percentage of people with one attribute versus another. Inclusion is more subtle and complex. It includes the many elements of the workplace that serve to acknowledge and value individual differences and encourage people to express their unique views.
“Diversity is being invited to the party. Inclusion is being asked to dance.” – Verna Myers ®
While this pop definition is memorable, it falls short in telling us what inclusion looks and feels like, or where it comes from. More nuanced descriptions often include elements such as a sense of belonging; trust in the company’s commitment to diversity; and the feeling of being seen, listened to, heard, respected, and valued. Some call it psychological safety.
But inclusion is not just a feeling, nor a static state. It is continuously created and reinforced—or undermined— through everyday conversations, meetings, leadership behaviors, managerial practices, and corporate policies. Because it is driven by an endless series of actions, “it’s more of a verb than a noun,” says one corporate D&I leader.
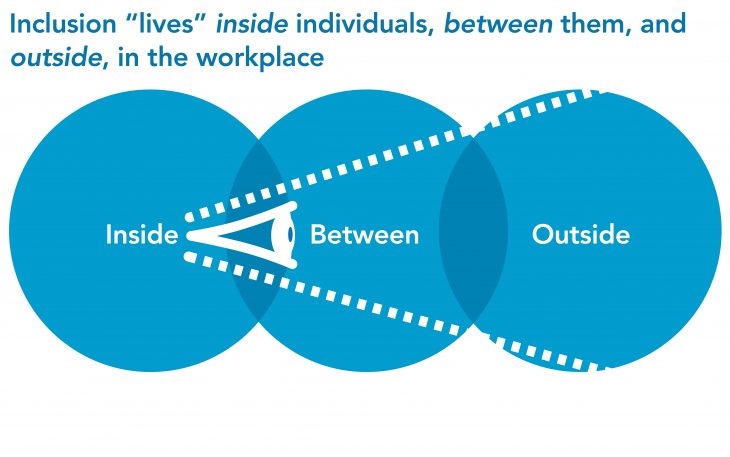
Figure 1 (below) shows a more comprehensive picture of where inclusion “lives” in the workplace.
- Inside people: Perception of being seen, heard, listened to, respected, valued, belonging, psychological safety
- Between people: Relational and behavioral: interactions with colleagues, immediate team, manager
- Outside people: Workplace and organization: culture, formal policies, work processes, decision making, access to information, developmental opportunities
Based on our research with companies and inclusion experts in North America, Europe and Asia-Pacific, here is a comprehensive definition that goes farther than being asked to dance:
In an inclusive workplace, everyone feels respected and valued for being who they are; people trust that they can speak up and be fairly treated; and they share a sense of belonging.
Inclusion is not a steady state. It is continuously created through the ways people and the organization operate. In an inclusive workplace, people can do their best work and organizations can gain the full benefit of a diverse workforce.
Why Focus on Inclusion?
From a financial point of view, inclusion is important because it can help organizations recoup their investments in building a more diverse workforce. They are unlikely to retain that talent or maximize its contributions if the workplace is not one that values differences. In the longer term, that could put the company at a competitive disadvantage.
Here’s another business case for inclusion: Teams and companies that are inclusive also innovate better, according to research. Inclusiveness spawns diversity of thought. And diversity of thought sparks new ideas, creative thinking, and why-didn’t-I-think-of-that? breakthroughs. More than three-quarters of the innovation leaders and D&I leaders who participated in a recent survey by The Conference Board agreed that an organization’s level of inclusion is related to its ability to innovate.
What’s the Hold Up?
If inclusiveness has such a positive business impact, why aren’t companies doing more or doing better at it? Sometimes it is because they have a simplistic definition, so it remains a fluffy aspiration on the company’s website. In other cases, leaders say that inclusion’s simply too soft, or subjective, to be measured—let alone to be held accountable for. Diversity is easier to tally. Inclusion, not so much.
On the upside, many companies have developed a clear understanding of what inclusiveness means in their culture. They have also educated their workforce, from top to bottom, about what makes for an inclusive workplace and why that matters. Some have gone a step farther: They are using a variety of tools and methods to measure both inclusiveness and the factors that will continue moving the needle in the right direction.
Using Data to Measure Inclusiveness
Companies have access to an increasingly sophisticated tool kit. Using a combination of approaches seems to work best.
Hold Focus Groups
Rather than relying on an off-the-shelf or top-down explanation of what makes for an inclusive workplace, companies can ask representative groups within their workforce to speak from their personal experience. For example:
What does your direct manager say or do that makes you feel valued and respected? In what ways does his/her behavior make you feel the opposite?
Tell me about a time when “being different” from others at work affected your willingness to share an opinion or idea.
How does your organization foster an environment where people who come from different backgrounds know that their ideas are valued? Where does it fall short? What specific actions would make it better?
Caveat: Doing this well requires reaching out to many different types of employees—not just members of employee resource groups. It also means engaging with, for example, individuals who work in offshore locations, or in support or back-office functions, or who are contingent workers rather than employees.
Conduct Surveys
Many organizations conduct company-wide engagement surveys every one or two years. Typically, these surveys include questions that indirectly address inclusiveness, making them an easy and convenient proxy measure. By comparing the responses of specific groups of employees—men versus women, managers versus non-managers, newcomers versus veteran employees—companies can identify highly inclusive teams or business units as well as trouble spots. These insights can then shape future priorities for further research, training, and intervention. Companies can also develop original survey questions based on the qualitative data they glean from focus groups.
Over the past decade, many organizations have developed expertise in human capital analytics, enabling them to correlate different variables related to their workforce, leadership, human resource practices, organizational structure, and business outcomes. They can do the same with survey data about inclusion.
Caveat: Because diversity is much easier to measure than inclusion, companies sometimes think they are doing the latter when, in fact, they are not. Let’s say an organization’s 2015 headcount shows that the percentage of women shrinks significantly as they progress up the ranks. In fact, the analysis reveals a spike in women who leave between Levels 5 and 6.
To combat this trend, leaders decide to increase their efforts to hire and promote female leaders. By 2019, the company employs twice as many female executives. Clearly, it has become more inclusive!
What the company is actually measuring, however, is diversity―in this case, the increase in gender representation. But this tells us nothing about inclusion in any of its manifestations: inside people (their perceptions and feelings); between them (their behavior and relationships); or outside them (the organization or team’s culture, policies, and practices).
Companies that want to create a scorecard for inclusion, or use those measures to assess and reward leaders, must be extremely careful not to conflate inclusion with diversity—that is, the dancing with the party.
Take Advantage of New Analytics Tools
The technology for analyzing workplace behavior is getting more powerful all the time. Here are some examples of tools that can help companies track inclusion and direct their efforts in a more targeted way:
Organizational network analysis (ONA) enables companies to understand the web of connections between one or more individuals, between one or more groups, or between the organization and its external environment. The data can come from the company’s communication and collaboration systems, or from other sources.
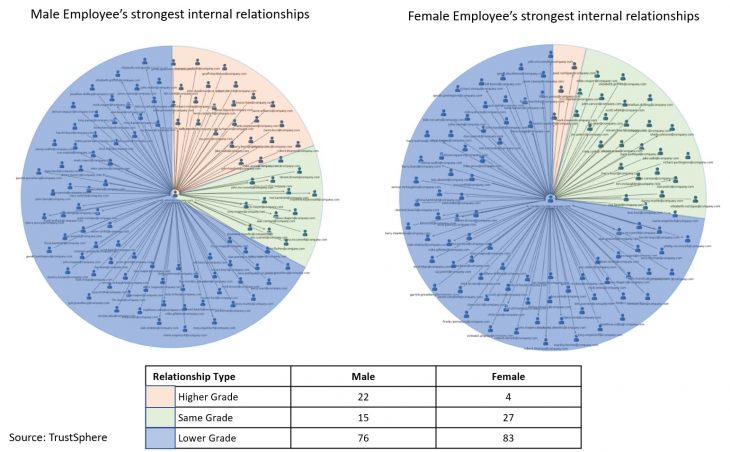
ONA produces a visual map, like the one in Figure 2, showing not only the number of connections in a network but also their strength. Analyzing internal networks can help a company to identify hidden talent so they can leverage it more effectively. A company could also compare the networks of their most successful teams with those of average ones, to tease out the connection patterns that are most strongly associated with high performance.
ONA can also help organizations become more inclusive. One company, for example, found that the networks of men and women looked quite different: Men built more connections with senior leaders than did their female peers. Women’s networks, on the other hand, included more people at their own or lower levels. These differences may have implications for women’s career advancement, says Manish Goel, CEO of Trustsphere, which tracks relationship networks within companies.
At another company, ONA revealed that women who had a strong relationship with a senior-level leader were the most likely to be promoted. That did not hold true for men, however; their career advancement was tied to having a broad network at all levels. Armed with these kinds of insights, companies can provide coaching and create projects that better level the playing field for men and women.
But is that inclusion? Arguably not, because while you can measure career progress over time, that doesn’t tell you what those women experience in their workplace. Do they feel safe speaking up to disagree? Are their voices heard when they come up with a new idea? Do they have to suppress or “cover” certain aspects of their identities to fit in, or do they feel seen, heard, and valued for bringing a unique perspective?
Caveat: In its most limited form, ONA can be just another way to measure diversity. It quantifies and visually depicts the representation of easily measured aspects of diversity within a network. But that is not inclusion. When ONA is combined with other kinds of data, however, it can be extremely powerful. You might correlate, for example, the number, composition, and strength of people’s network ties with their feelings of inclusion, as measured by selective survey questions. That would tell us which network factors were most strongly related to inclusion (although it still would not show causality–that is, which factor drove the other).
Leverage Digital Technologies
Digital technologies can provide more robust ways to understand and measure inclusion. Not unlike the sensors that capture real-time data about a physical space such as an office, sociometric badges, for example, collect data about people (with their full knowledge and consent). First developed at MIT and since commercialized by a company called Humanyze, these matchbox-sized devices record information about people’s movements and interactions: who they speak to, where, and for how long; who speaks first, who speaks longest, and whether they interrupt each other. What the badges don’t capture is anything people say.
Humanzye protects the identity of individual employees; client companies receive reports based on anonymized, aggregated data. But because Humanyze can match each person’s badge data with his or her demographics, it can look at subpopulations within the workforce. If it turns out that male employees have different communication patterns than females, for example, then the company may need to consider whether those differences play a role in the unequal advancement rates of men and women.
Caveat: The more sophisticated the technology becomes for collecting and analyzing employee data, the greater the imperative for companies to be completely transparent about their practices: what data they are collecting, along with how and why they are collecting it, how it will be managed, how it will protect individuals, and so on. There are few more vocal advocates for data protection than the CEO of Humanyze, Ben Waber. Companies must first spend substantial time in advance answering employee questions and allaying their fears. Stricter data-privacy regulations should not deter companies from incorporating digital data to understand inclusion and other workplace factors. They just need to be transparent and scrupulous about how they do it.

The Future of Measuring Inclusion
Many of the inclusion experts we interviewed are optimistic. Better workplace data and analytics, they believe, will eventually provide keener insights. Digital platforms will enable employers to mine real-time data from Slack, TeamRoom, Yammer, and other communication and collaboration platforms to identify strengths and diagnose issues before they manifest into bigger problems. Once they take corrective measures, they can analyze subsequent messages to gauge whether they are having any impact.
But organizations are not the only potential beneficiaries. Many of these analytics, including ONA, sociometric badges, and even e-mail headers, can also provide real-time feedback to individuals. “It’s like a Fitbit for your career,” says Waber.
Employees who opt-in (and, again, that is an essential pre-condition before an employer uses these tools) can receive a confidential report on their interactions over the past week, based on their e-mail headers and online calendar. It will show them how their own patterns compare to those of top performers. They might then choose to experiment doing things differently—say, reaching across organizational levels more often or starting up at least one conversation a week with people they do not know. By taking their own emotional pulse on a regular basis—there are apps for that, too—they can see if these changes affect their sense of belonging, trust, or psychological safety.
Measuring inclusion can also provide new insights about the role of work design in fostering inclusiveness. For example, the current backlash against open offices and their presumptive benefits. But what about inclusion? Are employees who look and think differently more comfortable speaking up in a secluded meeting room than in the wide-open prairies that some companies refer to as “the dorm” or “the pit”? Do introverts contribute more when their desks are located at the fringes of the agile-team’s space? Does repositioning the conveniences help groups bridge differences? Humanyze, the sociometric badge company, used its own data to learn that innovation and relationship-building flourished around the company’s coffee pot. As a result, they designed one with wheels and moved it around strategically, based on which teams had the greatest need for collaboration.
That is just one example of the way design can bolster inclusiveness. As employers get better at using technology, data, and analytics to understand the workplace, designers may play an increasingly important role in helping it become more inclusive.