
The inside scoop and data from Ted Moudis Associates’ 2018 Workplace Report.
We have reached a pivotal point in the field of workplace design. It’s hard to find an article published in the past several years that doesn’t highlight the importance of the employee experience, the need for collaboration or the increasing focus on wellness. If you were to take a poll right now of people working in the architecture, design, and real estate industries, I think that most people would say that square footage is decreasing. For certain organizations, they would be right. Many companies who relocate or lease space on a long-term lease haven’t yet reaped the benefits of increased design efficiencies. However, companies that lease space on a more frequent basis may feel that the square footage is actually increasing. As part of the workplace group at Ted Moudis Associates, we’d like to take a moment to talk about the how and why our data shows that we have reached the limit of densification.
We have been tracking metrics across the firm’s projects since 2012, and in 2016 decided to publish our first Workplace Report highlighting our findings. When we began tracking our data, it was considered progressive for an office to have an average usf of 175 per seat and to have 80 percent of staff in open plan seating. In our 2016 report, we saw an average of 142 usf per seat and 89 percent of staff sitting in open plan. Since the release of that report, we have seen the percentage of staff sitting in open plan continue to rise (92 percent) but have correspondingly seen an increase in usf per seat (165 sf). We attribute this shift to our clients’ greater understanding of the way their employees work. Efficiency is valued, but no longer at the cost of efficacy.
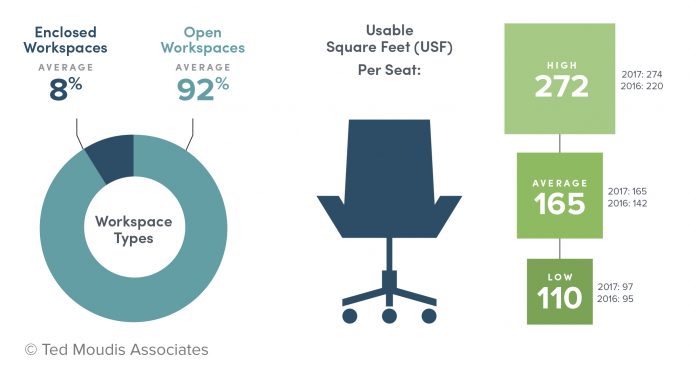
If more employees are sitting in open plan, and if workstation and office sizes have remained relatively constant, let’s talk about where the additional 13 usf per seat is being allocated. Designers and architects are now in a position to create new “alternative” spaces. In our lexicon, this breaks down into collaboration, amenity, wellness, focus, and gathering spaces. With Millennials comprising a large percentage of the workforce today, and the onslaught of the rapid tech economy, employers understand that they must create a workplace which can be leveraged in the attraction and retention of their employees. In today’s “progressive” workplace, success is measured by more than office size.
Choice through “alternative” spaces
Let’s talk more about those alternative spaces: If you were to count all the places to sit in an office you would have your total “seats”. We have taken those total seats and divided them by type. We subsequently broke them out into “work seats”, those at workstations and in offices, and “alternative” seats, which are those that are found in the collaboration, amenity, wellness, and focus spaces mentioned above. Until recently, most corporate office designs included work and meeting seats, but lacked in amenity, wellness, and focus seats. In our 2016 Report we saw a great influx of alternative seating options, but work seats held the majority at 53 percent. In the 2017 Report we saw these numbers flip, and today we see the number of alternative seats continue to rise.

Why is this happening? As more organizations adopt an open plan, the design industry and employers are recognizing that this isn’t increasing productivity for all employees. Yes, it’s great theoretically for “collaboration” and increasing efficiency with regards to space, but for the average worker it’s not conducive for the focus work that is often needed, and in fact it can be incredibly disruptive. It doesn’t always facilitate the most productive or inspiring conversations either. Although the traditional desk is designed for majority of the work employees may need to complete in a typical day, there are other spaces better suited for alternate tasks. For example, someone who needs a quiet space to write an article or crunch numbers may be better suited to a focus booth or quiet room. If a team needs to brainstorm a project room may be better suited. If you need to have a 1:1 or catch-up with your team, then having a conversation on casual sofa in an open setting may be better. It’s about creating those choices.
Creating an employee experience
Choice in where and how to work contribute to the employee the experience. Experience is about creating a holistic and informed design that support’s how employees work so that space becomes smart and not an obstacle. It’s also about creating a space that incorporates the mission and reflects the brand and values of an organization, while at the same time creating a sense of community and belonging. At the end of the day it’s also about employees feeling supported and inspired.
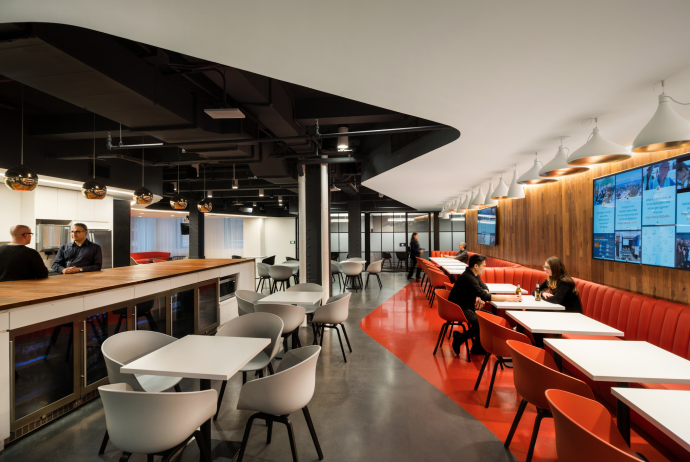
The experience is determined, in part, by the amenities; a great cup of coffee, a place to shower after biking to work, a space to rejuvenate midday, or access to outdoor space. Many employers are providing these amenities and services directly, others are relying on the landlord to provide these services within the building.
We have also seen big changes around the inclusion of space dedicated to employee wellness. According to the EPA, we spend 93 percent of our day inside our place of home, work, or transportation. There has been much progress in building with smarter materials and improving air quality and now the conversation has shifted to the space types that contribute to this as well. It’s not just physical wellness, but the mental and physical well-being of employees. We continue to see clients prioritizing employee health and wellness throughout the design process, from programming to final construction. We are providing a diverse assortment of wellness spaces beyond mother’s rooms or fitness centers. Bike and locker rooms, nap pods, gaming, prayer rooms, and spaces for focus all have become central to the design conversation. These spaces aren’t just being designed for the Googles and Facebooks of the world. Organizations competing for top talent are looking to designers and research focused on employee wellness to help their recruitment practices.
Adopting Activity Based Working
Activity Based Working (ABW) is a term that has been around for many years and is starting to gain more ground here in the States. It describes an office environment where no one has an assigned desk. When employees come into the office they can choose a place to work that will best support the task that needs to get done or allow them to collaborate or team with co-workers at any given time on any given day.

An ABW office provides many qualitative benefits; knowledge sharing between colleagues, access to leadership, improved wellbeing, rapidity of information transfer, and greater flexibility for both the individual and the organization. To those coming from a more traditional work environment, this solution is neither a one size fits all model, nor is it the right solution for everyone. For those organizations which this solution benefits, we have noticed some interesting trends here as well. Surprisingly, the square footage per seat in an activity based working environment is higher than that of a traditional office, this past year we saw the square footage at 177 usf per seat, which is an increase of 18 square feet per seat. It is important to realize that in most ABW environments the more effective way to measure square footage utilization is by person and not by seat. This year we recorded an average sf per person of 131 as opposed to the 162 sf per person of a traditional office. Considering this number is on the rise as well, up from 124 sf per person in the 2017 Report, we can conclude that even in ABW environments we are seeing a rebound from the densification.
So, what does this all mean?
We believe that employers are understanding the importance that the physical workplace plays in the success of their organization and the achievements of their staff. Employees thrive when they feel they have flexibility, balance, and ownership over where and how they get work done. Organizations are providing spaces for their employees that meet these needs. One could surmise that by creating a well-designed space to meet the needs of a diverse organization, productivity increases, and in doing so, allows organizations to reap the benefits of these solutions while increasing their real estate footprint slightly. The benefits of positive employee experience outweigh the added real estate costs incurred. We are all lucky to be working during this time in the design industry as there are some really exciting ideas taking hold. We are continuing to track this data and are curious to see where the numbers lead us next.
We have our predictions. What are yours?